Analyzing Countrywide Listening Patterns Using Spotify API
Abstract
This study aims to explore countrywide listening patterns using the Spotify API. The methodology encompasses a detailed extraction process to analyze Spotify playlists representative of America's pool of listeners and applies various data science tools including principal component analysis (PCA) and K-Means clustering to the extracted audio features. The goal is to uncover the evolving musical preferences across different years and to understand how these preferences reflect wider cultural and social trends. By applying hypothesis testing, the study investigates significant changes in listening habits over the years, providing a comprehensive view of the shifting landscape of music consumption. This research not only highlights the utility of the Spotify API in cultural analytics but also opens up avenues for further interdisciplinary studies in musicology, sociology, and data science.
Introduction
Spotify is a widely popular streaming music service developed and launched by Daniel Ek and Martin Lorentzon in 2008[1] and has since grown to 574 million active listeners as of September 2023[2]. Due to the platform's massive adoption rate across the globe, along with its focus on data-driven playlist creation and data accessibility, it provides the perfect opportunity for data exploration.
Using Spotify's API, a user has the ability to analyze the content of an artist's entire discography, a specific album, a popular playlist, or an individual's unique listening experience, and can provide data down to the millisecond of an individual song[3]. The options are virtually endless, and with that, it fosters an excellent opportunity to perform exploratory analysis using data science techniques.
Yearly, Spotify will take a deep-dive into each individual's profile to analyze listening patterns and to present those results visually within the mobile app. While this analysis is fascinating at an individual or close-friend-group level, it piques some curosity as to how these listening trends affects a larger audience, for example, the entire average listening population of the United States. While the ability to view strong trends at such an aggregate level is difficult, it still provides an interesting opportunity to discuss subtle fluctations in listening trends and to open the door to wider discussion in cultural, economic, or political influences.
This exploratory analysis will first focus on the available data from the Spotify API and possible use cases of that data. Next, we will discuss the meaning of Spotify's collection of audio features and a breakdown of how those features are generated. Finally, we will outline the data extraction process, the PCA and K-Means clustering results, and the scenarios used for hypothesis testing.
Methods
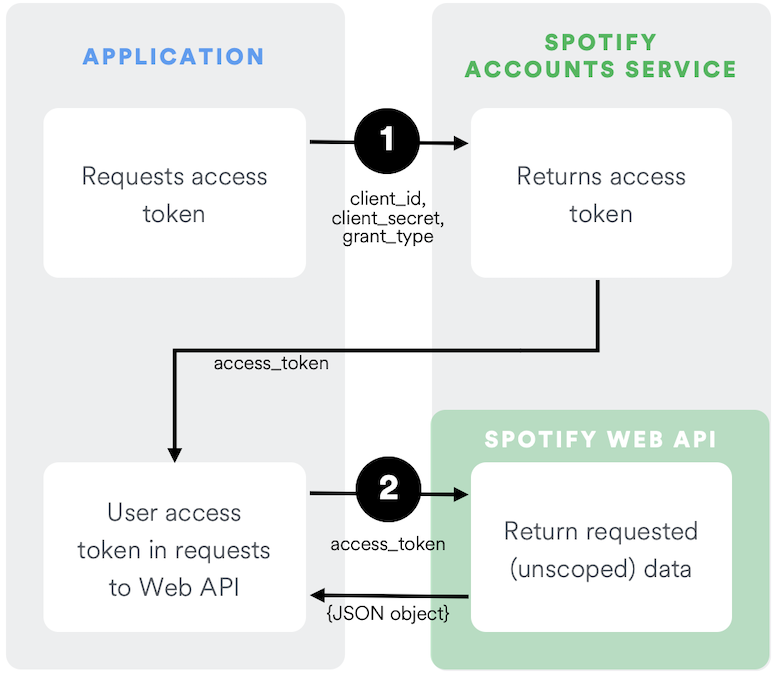
Spotify uses the OAuth 2.0 standard for its API authorization, which requires the user to request an access token before any GET requests will return results.[3]
 [3]
[3]
As seen in the above diagram, the user first authenticates with Spotify using their own identification key and API access key. If all parameters are set correctly, the POST request will return an access token. This access token can be used for full access to Spotify's API for one hour, after which it will expire and the user will need to request a refreshed access token.
Every request to the API from here on out will require some form of ID, whether it be an artist, album, playlist, or song. To find an ID, the user can search for the desired level of detail within the Spotify website or mobile app. When entering a page, the user will find an elipses, usually at the top of the page, that can be used to copy the artist/playlist/album link. The ID can then be found within the link to that particular Spotify item.

The main categories of available data that can be accessed through the Spotify API include: artist information, albums, tracks, genres, playlists, podcasts, and audiobooks. Since we are focusing on audio information and countrywide listening patterns, we will focus in on the music-specific categories.
Artist
The artist category is generally the most straightforward request out of the Spotify API
library. It contains high level information including artist name, associated genres, a popularity ranking,
and number of followers.
| name | genres | popularity | followers |
|---|---|---|---|
| Delta Sleep | brighton indie, british math rock, math pop | 42 | 82579 |
Albums
Since this analysis is more focused on collections of songs and their audio features, we may find use for the
albums extraction method. By utilizing the same artist ID from above, we can extract a complete
list of albums associated with that artist.
| name | release_date | total_tracks | type | id |
|---|---|---|---|---|
| Spring Island | 11/12/21 | 12 | album | 4JeLdGuCEO9SF9SnFa9LBh |
| Soft Sounds | 7/31/20 | 10 | album | 3DLLrOiGk1kUjFpSCqz3q4 |
| Ghost City | 8/10/18 | 11 | album | 63PgGSb6ZkwPVfMZVOhObO |
| Twin Galaxies | 7/8/15 | 11 | album | 1bcWJMGRvDhvKHNmQmTTCd |
| Management | 5/20/13 | 7 | album | 4vsD6pgRkIAnHYxeTUMHbw |
However, we still only receive high-level album information and lack of audio track data.
Tracks
Using the above IDs from the album extraction process, we are able to loop through and pull every song from
each album and add to a dataframe. This provides us with some high level detail on each song, including
popularity, associated genre, available markets, and track duration. However, by utilizing the
audio-features GET request, the results become a bit more interesting.
| artist | Delta Sleep |
|---|---|
| track_name | El Pastor |
| danceability | 0.298 |
| energy | 0.731 |
| key | 2 |
| loudness | -7.52 |
| mode | 1 |
| speechiness | 0.079 |
| acousticness | 0.00879 |
| instrumentalness | 0.00145 |
| liveness | 0.0968 |
| valence | 0.185 |
| tempo | 60.497 |
| duration_ms | 310047 |
In the above table, there are key audio features that aim to describe the aspects of the song. While the development of these metrics are proprietary, the documentation still offers a brief overview of what each metric means.
| Attribute | Type | Description | Range | Example | |
|---|---|---|---|---|---|
| acousticness | number [float] | A confidence measure from 0.0 to 1.0 of whether the track is acoustic. 1.0 represents high confidence the track is acoustic. | 0 - 1 | 0.00242 | |
| analysis_url | string | A URL to access the full audio analysis of this track. An access token is required to access this data. | "https://api.spotify.com/v1/audio-analysis/..." | ||
| danceability | number [float] | Describes how suitable a track is for dancing based on a combination of musical elements including tempo, rhythm stability, beat strength, and overall regularity. 0.0 is least danceable and 1.0 is most danceable. | 0.585 | ||
| duration_ms | integer | The duration of the track in milliseconds. | 237040 | ||
| energy | number [float] | A measure from 0.0 to 1.0 representing a perceptual measure of intensity and activity. E.g., death metal has high energy, while a Bach prelude scores low. | 0.842 | ||
| id | string | The Spotify ID for the track. | "2takcwOaAZWiXQijPHIx7B" | ||
| instrumentalness | number [float] | Predicts whether a track contains no vocals. Values above 0.5 are intended to represent instrumental tracks, but confidence is higher as the value approaches 1.0. | 0.00686 | ||
| key | integer | The key the track is in, using standard Pitch Class notation. E.g., 0 = C, 1 = C♯/D♭, 2 = D, etc. If no key was detected, the value is -1. | -1 - 11 | 9 | |
| liveness | number [float] | Detects the presence of an audience in the recording. Higher values represent an increased probability that the track was performed live. A value above 0.8 indicates that the track is likely live. | 0.0866 | ||
| loudness | number [float] | The overall loudness of a track in decibels (dB). Loudness values are averaged across the entire track and are useful for comparing relative loudness of tracks. | -5.883 | ||
| mode | integer | Indicates the modality (major or minor) of a track. Major is represented by 1 and minor is 0. | 0 | ||
| speechiness | number [float] | Detects the presence of spoken words in a track. Values above 0.66 describe tracks probably made entirely of spoken words; values between 0.33 and 0.66 may contain both music and speech; values below 0.33 most likely represent music. | 0.0556 | ||
| tempo | number [float] | The overall estimated tempo of a track in beats per minute (BPM). | 118.211 | ||
| time_signature | integer | An estimated time signature, specifying how many beats are in each bar (or measure). The time signature ranges from 3 to 7 indicating time signatures of "3/4", to "7/4". | 3 - 7 | 4 | |
| track_href | string | A link to the Web API endpoint providing full details of the track. | "https://api.spotify.com/v1/tracks/..." | ||
| type | string | The object type. Allowed value for this context: "audio_features". | "audio_features" | ||
| uri | string | The Spotify URI for the track. | "spotify:track:2takcwOaAZWiXQijPHIx7B" | ||
| valence | number [float] | A measure from 0.0 to 1.0 describing the musical positiveness conveyed by a track. Tracks with high valence sound more positive, while those with low valence sound more negative. | 0 - 1 | 0.428 | [3] |
Playlists
Now that we have a grasp on collecting track information, we now need a way to collect large amounts of songs
for analysis. Using the playlist endpoint, we can collect a list of songs from a specific
playlist and run the audio-features collection process on each song in that list.
First, we need to identify a set of playlists. The original idea was to use top streamed songs from the past five years, but after some additional research we found that this selection may not be the most representative of the true listening body of the United States. Consider the top 10 streamed songs of all time (as of this writing in December 2023):
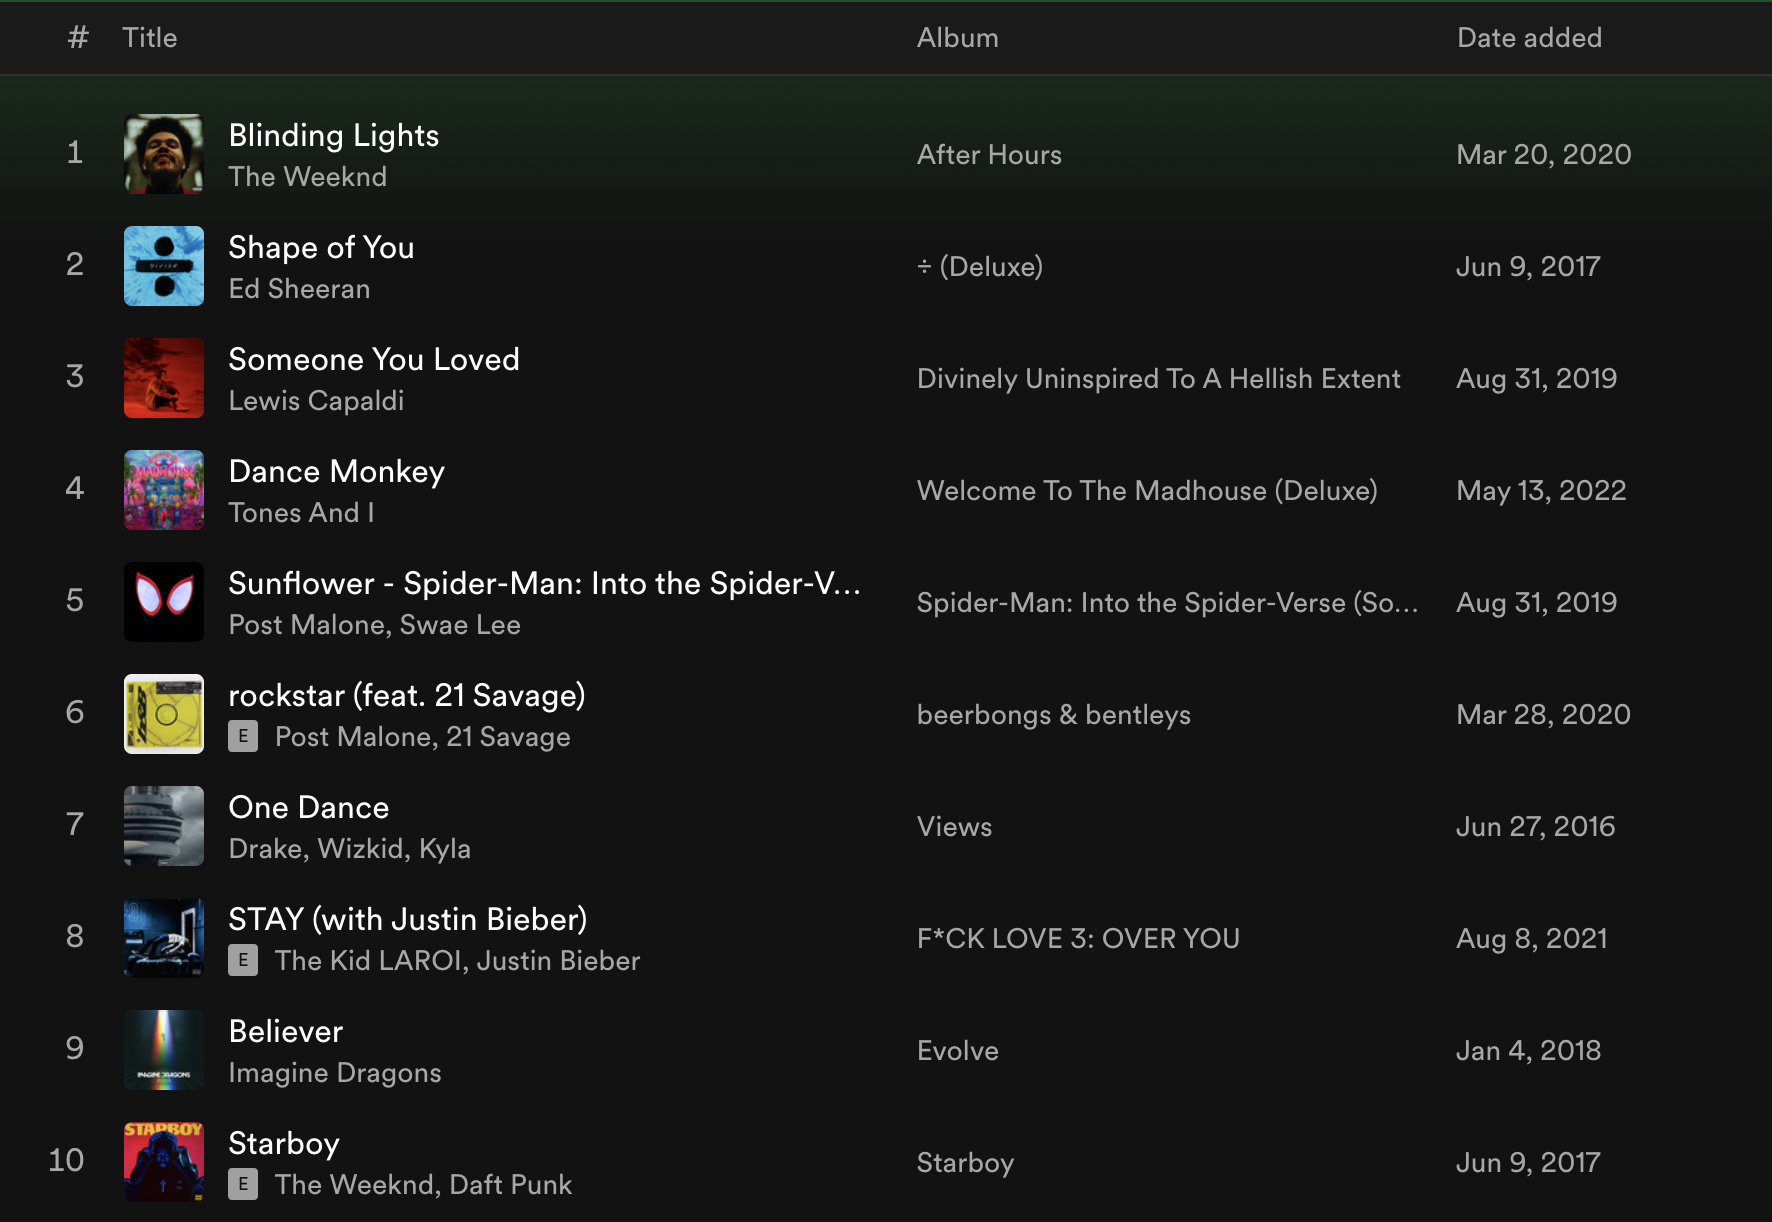
Looking at the release date, these end up being relatively old songs. Not a single song in this top 10 list was released in 2023. Without detracting from the main point of this paper, there could be additional research done on how "top streamed songs" become over-streamed, as they are continually added to generated playlists, played in retail stores, or played over bar speakers night after night on repeat, thus creating a cycle. For example, the Imagine Dragons song, "Believer" can be found on the official Jimmy John's playlist on Spotify ("Jimmy Tunes"). Considering that Jimmy John's has over 2,600 sandwich shops across the United States[4] playing the same playlist nearly 365 days a year, it is likely the song is picking up stream count without truly reflecting the listening preferences of the general population.
Through research, we found the head Data Scientist of Spotify, Glenn McDonald, and his personal website everynoise.com. This website aims to produce a scatterplot of every genre of music, and categorizes them in quadrants. As Glen McDonald describes, "[t]he calibration is fuzzy, but in general down is more organic, up is more mechanical and electric; left is denser and more atmospheric, right is spikier and bouncier."[5] Along with this is a playlist generator that samples the listening base of Spotify and creates representative playlists. This lead to the finding of "Playlists of the World," sorted by country and year. These playlists serve as the basis for our analysis.
Hypothesis Testing
Lastly, we need to determine if there is a significant difference in the average audio features of the songs in the playlists. To do this, we will use a two-tailed hypothesis test, comparing the means of each feature between two groups of years: 2019-2020, and 2022-2023.
Results
The first step of this data exploration involves examining distributions, and to determine if there are any interesting relationships to examine.
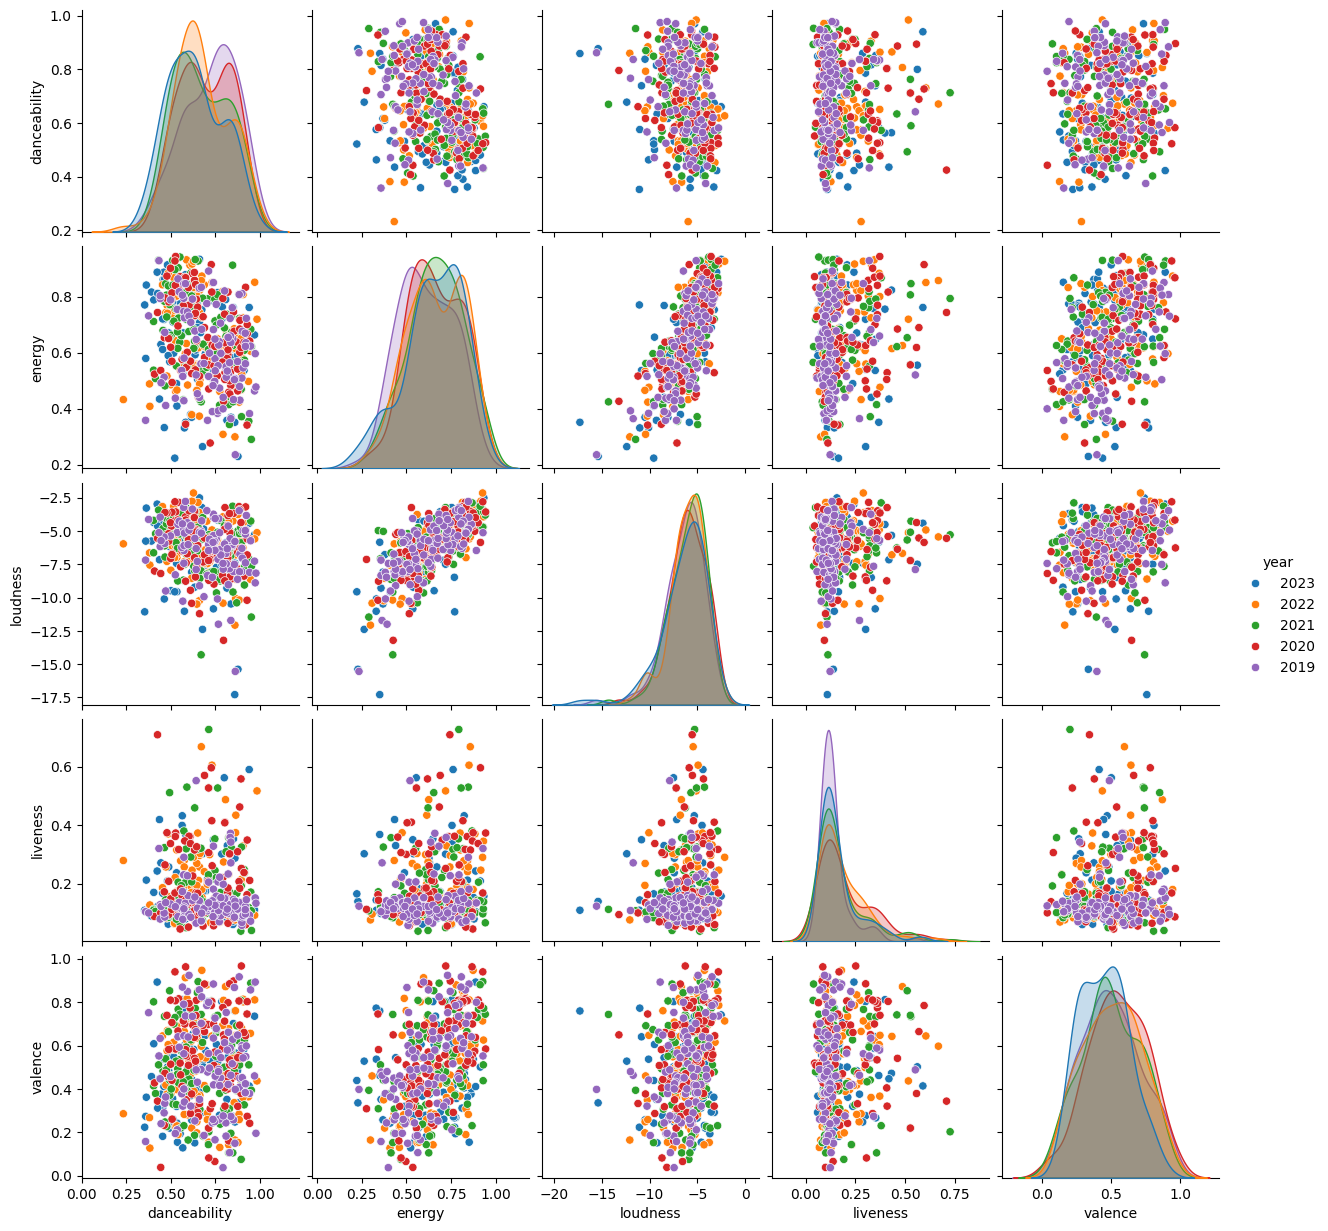
While the above pair plot is relatively useful for this exercise, the amount of features to examine becomes unwieldy. To make the analysis more manageable, we then perform a principal component analysis (PCA) to reduce the dimensionality of the data, and perform a K-Means clustering to further group the data for visual inspection.
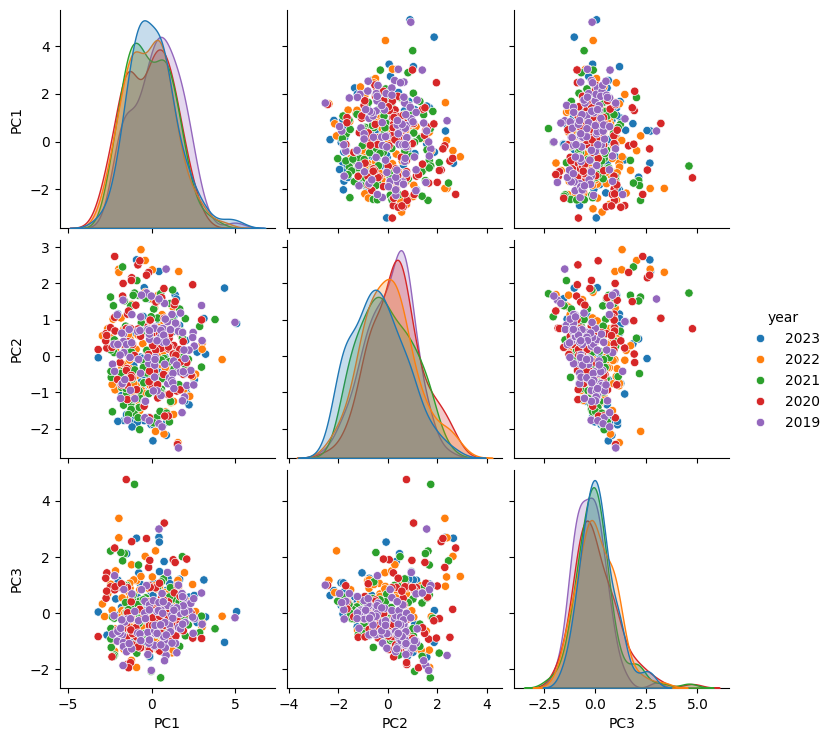
Through singular value decomposition, we can reduce the pair plot down to 3 PCAs, explaining over 80% of the variance and consisting of the following loadings.
| feature | PC1 | PC2 | PC3 |
|---|---|---|---|
| danceability | 0.286675 | 0.678492 | -0.302865 |
| energy | -0.636712 | -0.01769 | -0.065124 |
| loudness | -0.589309 | -0.119927 | -0.039598 |
| liveness | -0.162476 | 0.50052 | 0.847655 |
| valence | -0.372468 | 0.523862 | -0.428888 |
The first PCA, representing 41% of the variance, consists mainly of a negative relationship to energy and loudness and conversely a positive relationship to danceability.
Next, we examine the dataset using K-Means clustering. Using the elbow method, we select 3 clusters as the optimal k, and plot the PCAs in a three dimensional graph.
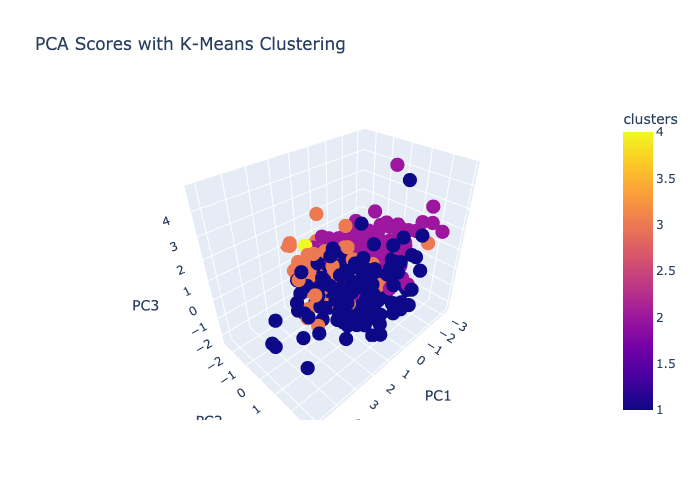
While there is a distinction among groupings, the points are still compact and the interpretations are not as clear as one would hope. In general, the groupings lend themselves to different genres, making up distinct characteristics that separate themselves from other clusters. Cluster 1 is generally hip-hop and rap, and tends to center in the middle of PC1 and high positive values for PC2. Cluster 2 has a wider mix of genres, but tends to be popular top 100s country-music. The clustering is generally centered around negative PC1 and negative PC2. Cluster 3 has a mix of rap, country, and pop music, although tends to be less popular than cluster 2. This cluster seems hardly influenced by PC3 and spans PC1 and PC2. Finally, cluster 4 ends up being an outlier, and represents a single song (Chris Staplton - White Horse). In the future if given opportunity to revist the analysis, we would better incorporate genre into the initial data pull and take a closer look.
Lastly, we examine differences in the average audio features of the songs across different years. To do this, we will use a two-tailed hypothesis test, comparing the means of each feature between 2019-2020 and 2022-2023.
After examining the distributions of each feature and considering the characteristics of those attributes, we perform the calculations below using a significance level of 0.05.
P-Values 2019 vs 2020
- Danceability (0.199): Not significant; fail to reject the null hypothesis.
- Energy (0.016): Significant; reject the null hypothesis.
- Loudness (0.2595): Not significant; fail to reject the null hypothesis.
- Speechiness (0.0062): Significant; reject the null hypothesis.
- Acousticness (0.9762): Not significant; fail to reject the null hypothesis.
- Instrumentalness (0.1659): Not significant; fail to reject the null hypothesis.
- Liveness (0.0002): Significant; reject the null hypothesis.
- Valence (0.0971): Not significant; fail to reject the null hypothesis.
- Tempo (0.6281): Not significant; fail to reject the null hypothesis.
P-Values 2022 vs 2023
- Danceability (0.0787): Not significant; fail to reject the null hypothesis.
- Energy (0.5797): Not significant; fail to reject the null hypothesis.
- Loudness (0.1714): Not significant; fail to reject the null hypothesis.
- Speechiness (0.3857): Not significant; fail to reject the null hypothesis.
- Acousticness (0.584): Not significant; fail to reject the null hypothesis.
- Instrumentalness (0.288): Not significant; fail to reject the null hypothesis.
- Liveness (0.1464): Not significant; fail to reject the null hypothesis.
- Valence (0.0381): Significant; reject the null hypothesis.
- Tempo (0.8029): Not significant; fail to reject the null hypothesis.
In summary, for the comparison between 2019 and 2020, there's significant difference in the attributes of energy, speechiness, and liveness. For the comparison between 2022 and 2023, only the attribute valence shows a significant difference. All other attributes do not show statistically significant differences in these comparisons.
Conclusion
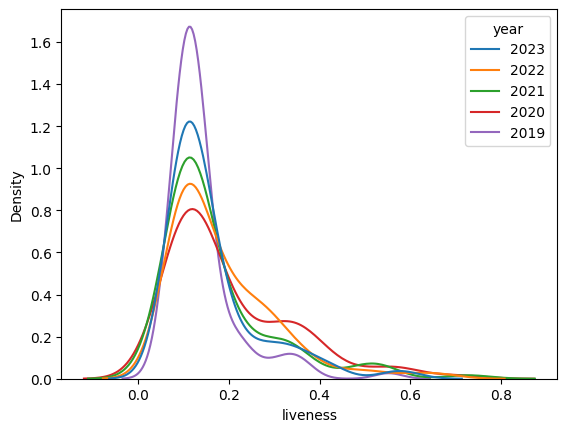
One of the most interesting points can be found in the hypothesis testing section of our results. Between 2019 and 2020, the data suggests a shift in liveness of music.
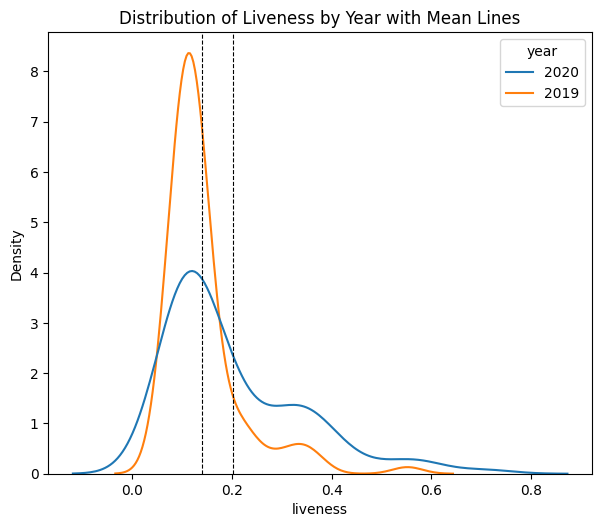
The tail seems to fatten and the density around the mean appears to flatten compared to 2019. This suggests that US listeners on average tended to gravitate towards music with more live sounds, including live audiences. This is particularly interesting, noting the bulk of the Covid global pandemic and lockdowns occurred in 2020. This suggests that people, while potentially feeling isolated during this time, perhaps desired more of a live sound -- something that was not quite available to experience in person at all.
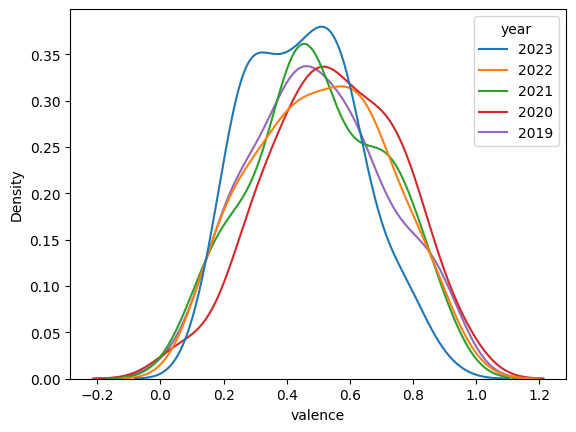
The second point is the shift in valence, or emotional positivity, in music during 2022 to 2023.
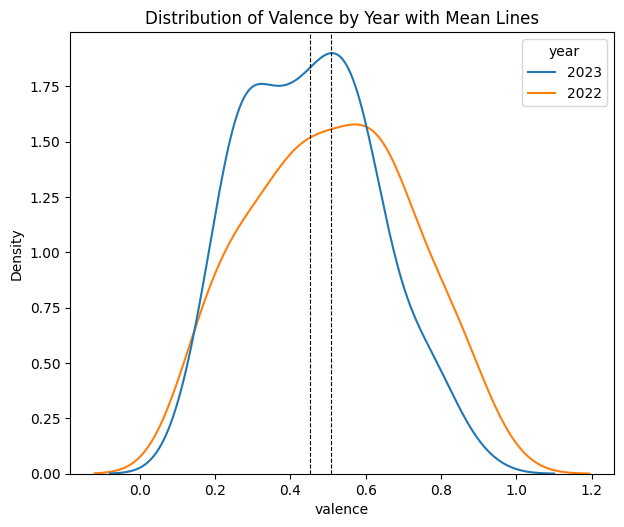
The distribution for valence shifted more negatively from 2022 to 2023. This suggests a broader change in listening patterns that pushed people towards more negative or sadder music.
Examining the listening patterns of a country using representative playlists provides a unique perspective into the emotional states of its listeners. By looking at results, one may take a retrospective look at what has happened, whether socially (e.g. lockdowns), economically (e.g. cost of living), or politically (e.g. elections, geopolitical conflicts and war) to get insight into what is affecting its people on an emotional level. This analysis also encourages future exploration into more predictive modeling to potentially determine where we are headed.
References
-
Sweney, Mark. “Spotify UK Revenues Surge to Almost £190m as Mobile Subscriptions Take Off.” The Guardian, October 14, 2016, sec. Media. https://www.theguardian.com/media/2016/oct/14/spotify-uk-revenues-surge-to-almost-190m-as-mobile-subscriptions-take-off.
-
Spotify. “Spotify — About Spotify.” Accessed December 3, 2023. https://newsroom.spotify.com/company-info/.
-
“Web API | Spotify for Developers.” Accessed December 3, 2023. https://developer.spotify.com/documentation/web-api.
-
“Discover Sandwich Restaurant Franchise Information,” December 13, 2022. https://www.jimmyjohnsfranchising.com/about-us/.
-
McDonald, Glenn. “Every Noise at Once.” Every Noise. Accessed December 4, 2023. https://everynoise.com/.
https://blog.insileco.io/2023/04/02/academic-writing-with-markdown-visual-studio-code-and-zotero/