Conclusions
The primary objective of this research was to develop a predictive model capable of forecasting riverflow in the Colorado River Basin. Such a model would serve as a tool for water managers tasked with making critical decisions about water allocation, drought mitigation, and long-term resource planning. By integrating climate projections with historical data, the model aims to provide actionable insights to help mitigate water shortages and ensure equitable distribution among stakeholders.
Historical data used in this research include precipitation, temperature, snow and snow-water-equivalent measures, soil moisture, and streamflow. Along with that, we use representative concentration pathway (RCP) scenario data, which originates from the Working Group on Coupled Modeling (WGCM), who puts together the coupled model intercomparison data (CMIP). These climate models have very low resolution and span the entire globe, therefore, other smaller more targeted institutions such as the Canadian Centre for Climate Modeling and Analysis publish a higher resolution dataset for North America called CORDEX. CORDEX data was used to model the RCP scenarios.
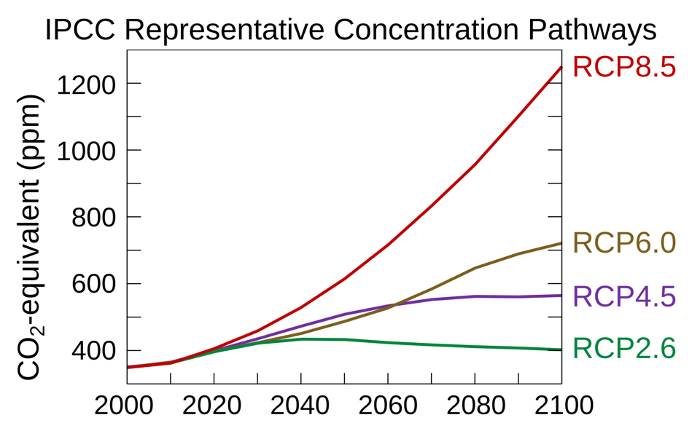
The RCP scenarios chosen for the modeling are the 4.5 and 8.5 scenarios. The 4.5 scenario represents plausible CO2 increases to the atmosphere over the next century, and will represent our base case. The 8.5 scenario represents increasing CO2 emissions and lack of efforts to curb this, resulting in increased warming and highly variable precipitation, extreme wetness and/or dryness. The 8.5 will represent our worst case scenario.
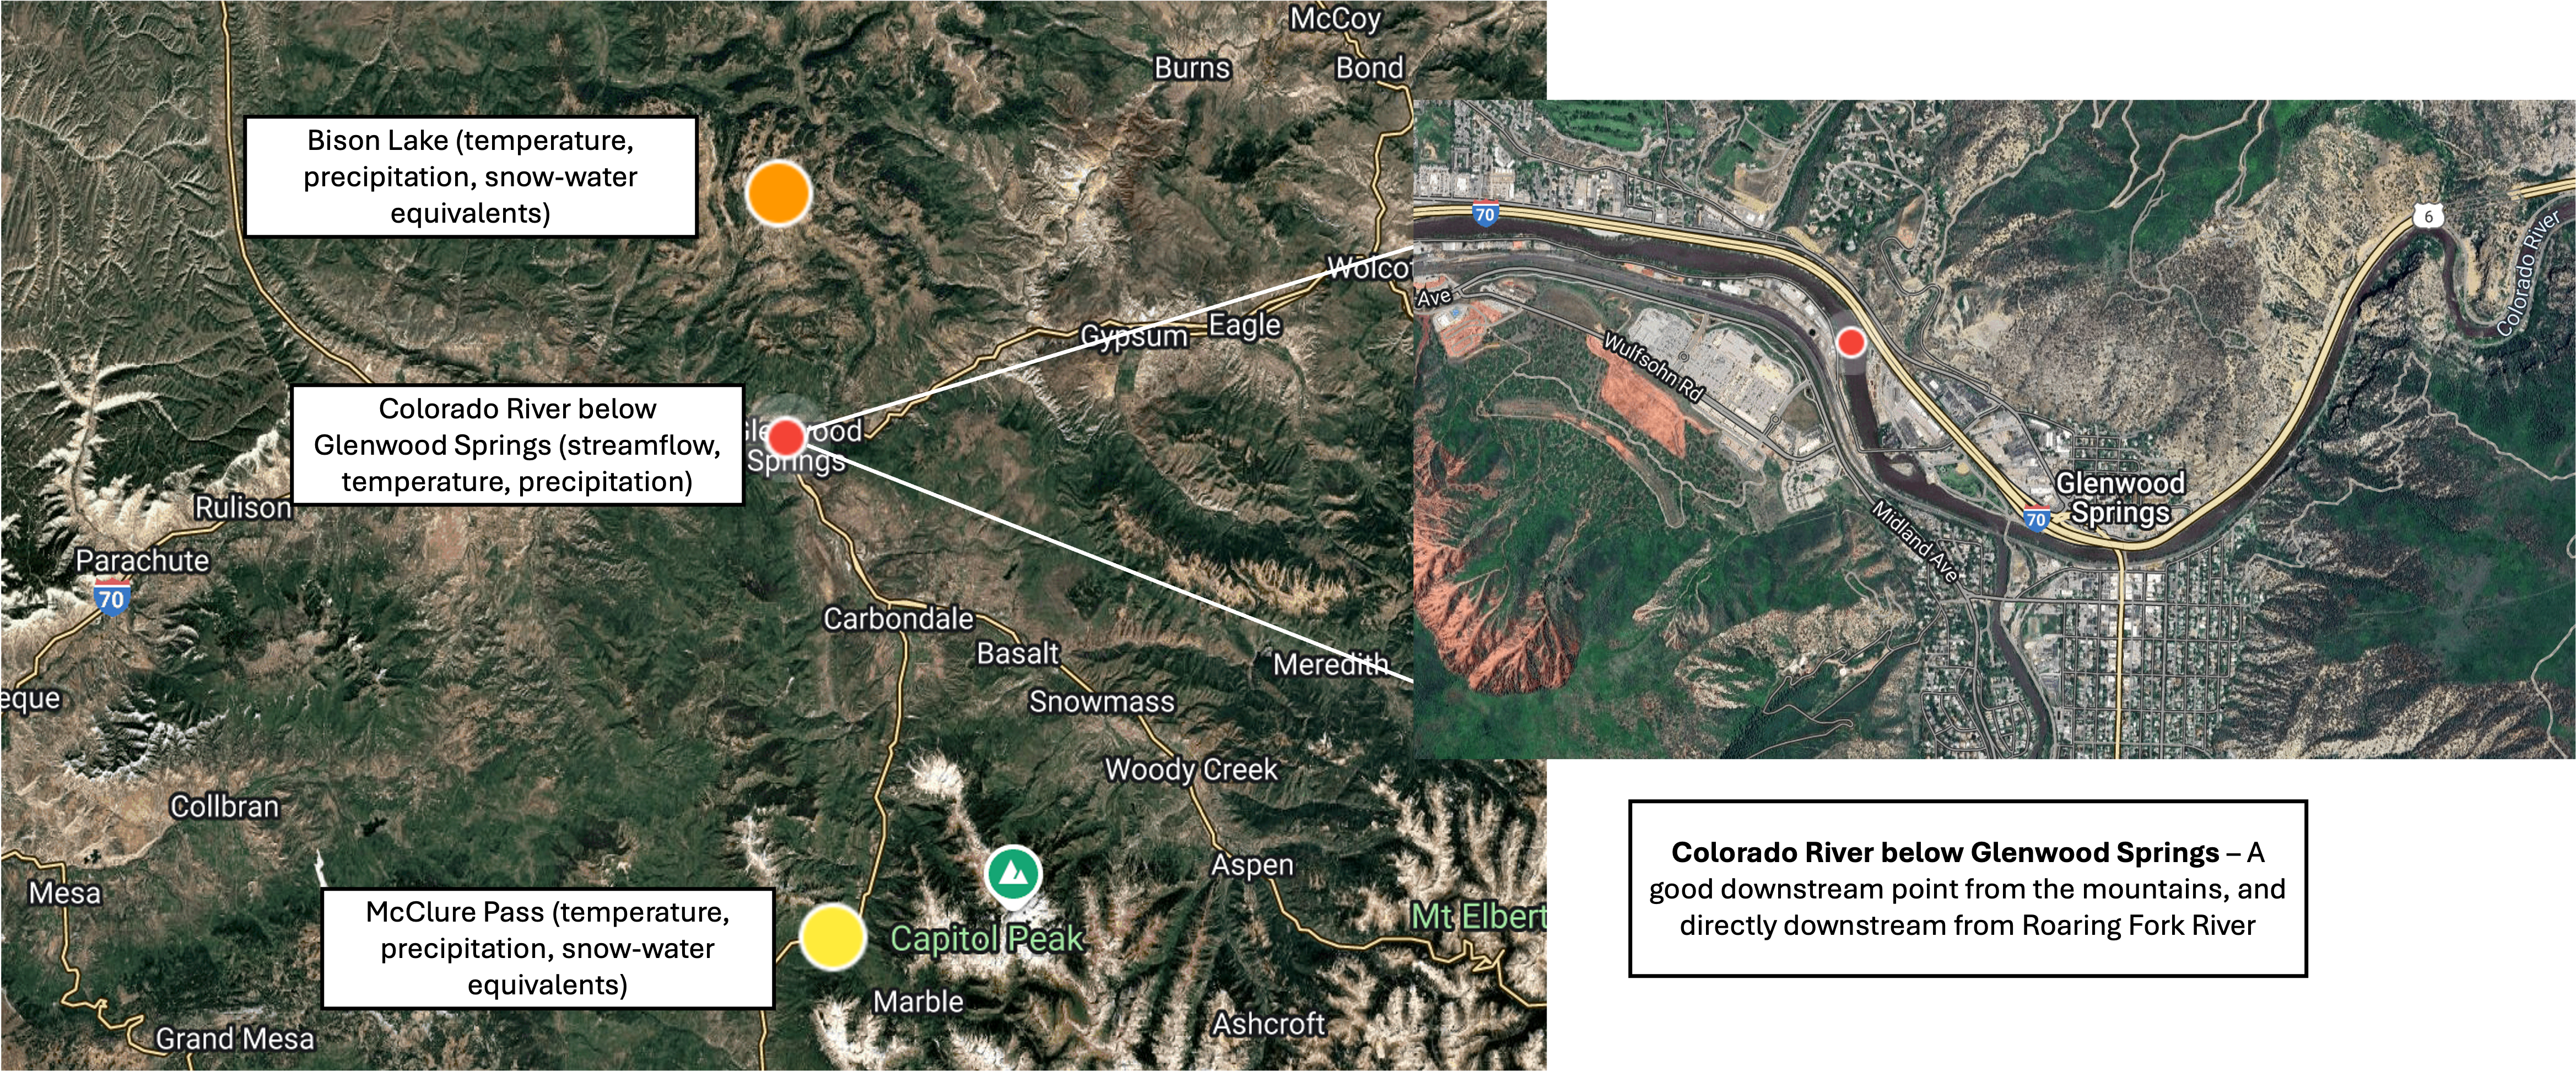
This analysis was highly sensitive to geographic location. Therefore, the locations chose were strategic to best represent the relationship between precipitation, temperature, snow, snowmelt, and soil moisture. The Colorado River measuring location is just downstream of Glenwood Springs, after several smaller streams and rivers converge to the Colorado River. The two USGS data sites were McClure Pass and Bison Lake, which are two locations above 8,000 feet in elevation. Precipitation is expected to run off to smaller streams and rivers and eventually join to the Colorado River over time, impacting streamflow levels.
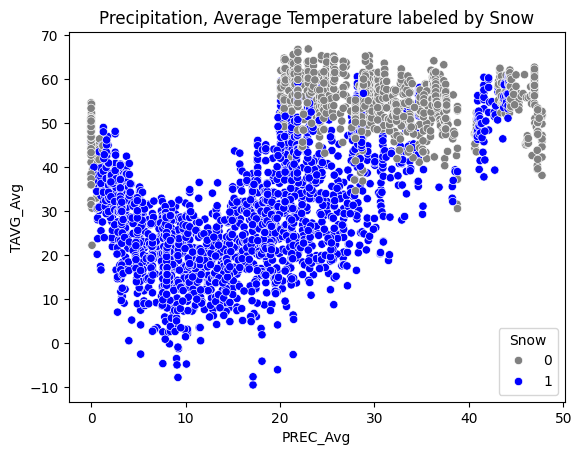
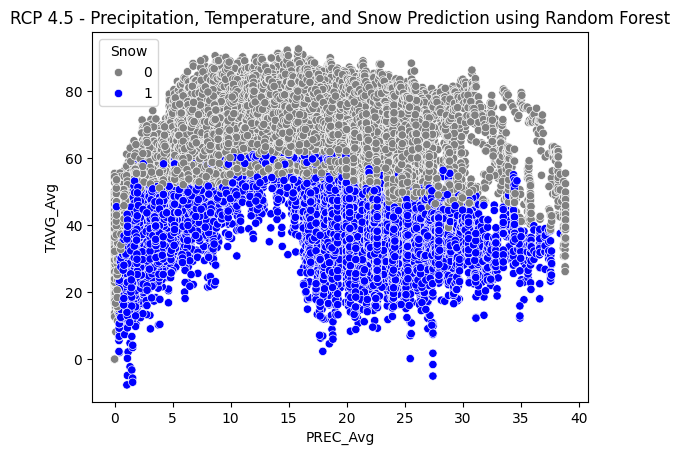
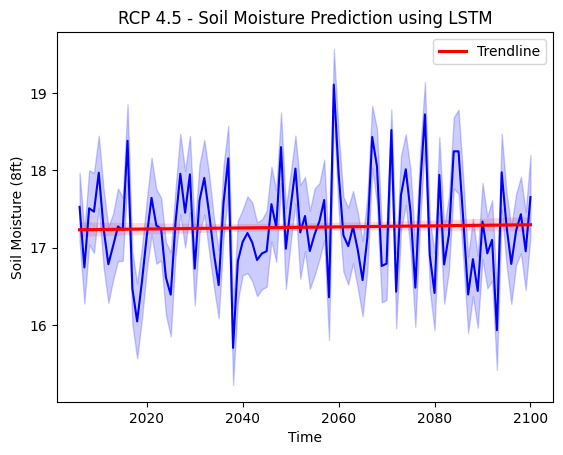
A robust approach was taken to modeling by utilizing several different techniques and model ensembles. While the RCP is invaluable to our prediction efforts, the data was limited to precipitation and temperature expectations to 2100. Therefore, we model a snow-day label (did it snow, yes or no) using a random forest approach. We model soil moisture at an 8ft depth using an LSTM neural network approach to forecast as a time series. We then take these trained/tested models and apply them to RCP scenario data to gather an understanding of how snow and soil moisture change over time.
Overall, the random forest approach does a great job at mapping snow labels and we can be fairly confident of interpretting the results here. In general, we see an overall decreasing trend as temperature is expected to rise in both RCP 4.5 and RCP 8.5. There are expected to be less "snow days" on average in the RCP 8.5 scenario compared to the RCP 4.5.
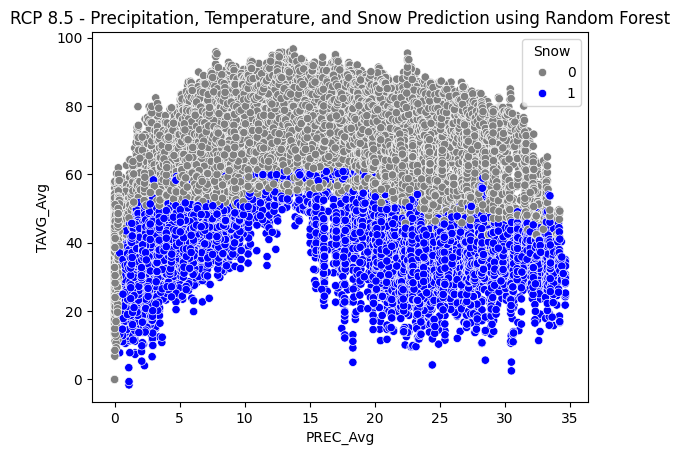
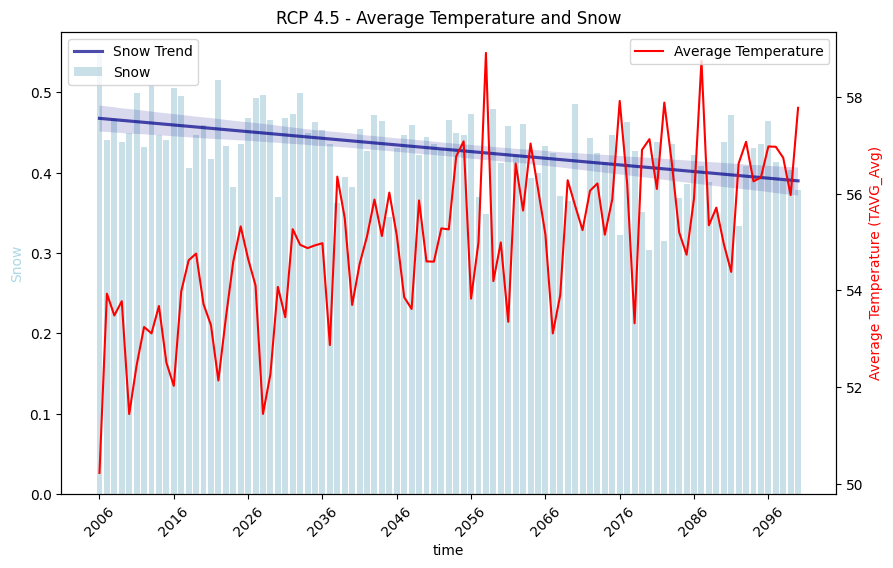
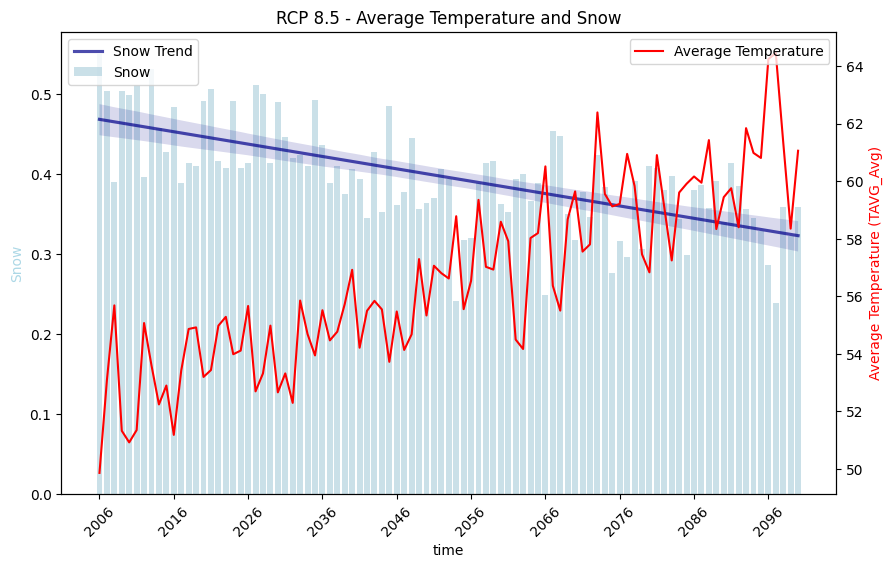
The LSTM model to soil moisture gives us a good sense of how soil moisture may change over time. Soil moisture is a key component to streamflow and is important to measure and utilize as a feature in our final streamflow model. Under RCP 4.5, we observe a flat to slightly positive trend. It's possible we're getting signal that increased temperature may cause earlier snowmelt than historical average, resulting in a slightly more moist yet volatile environment. Under RCP 8.5, we see a clear downward trend that indicates a drier soil.
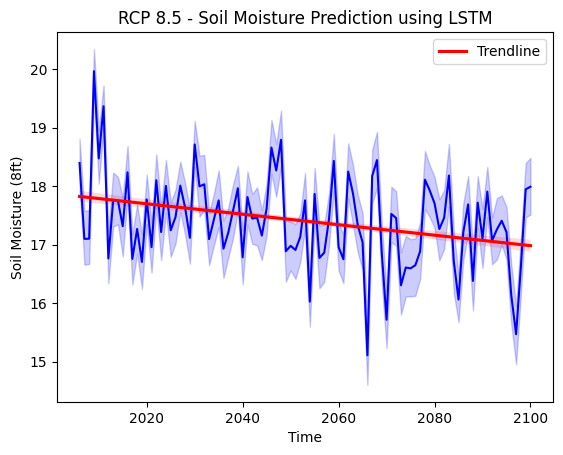
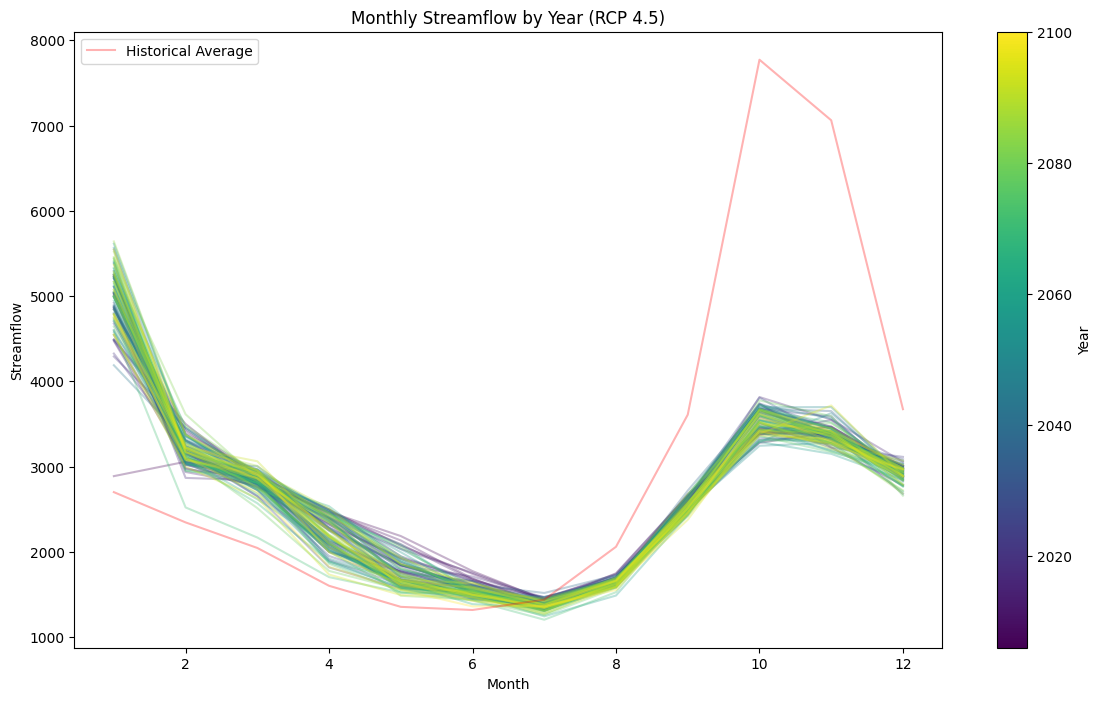
For our final streamflow prediction model, we utilize the outputs of two modeled features, soil moisture and snow labels, along with RCP temperature and precipitation assumptions. Based on increasing temperatures, fewer snow days, and generally decreasing soil moisture, we see the effects of climate change play out in our modeled data. The overall trend suggests that mean streamflow will decrease in the next 70-80 years, indicating a potential real problem for downstream states that rely on this water. The model does struggle to predict the extremes of streamflow, whether high or low cubic feet per second. Despite the limitations of interpretation, the model still gives us a generally good sense of mean changes over time. There is some indication that early to late spring may produce higher streamflows on average due to earlier snowmelt, reach drier than normal conditions in the summer, and then fail to produce historically peak streamflows going into the winter months.
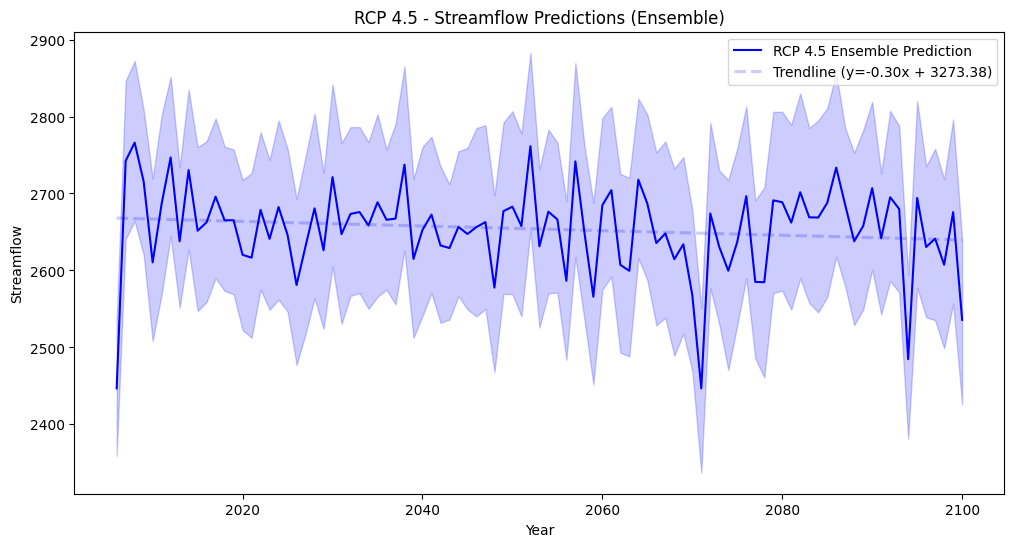
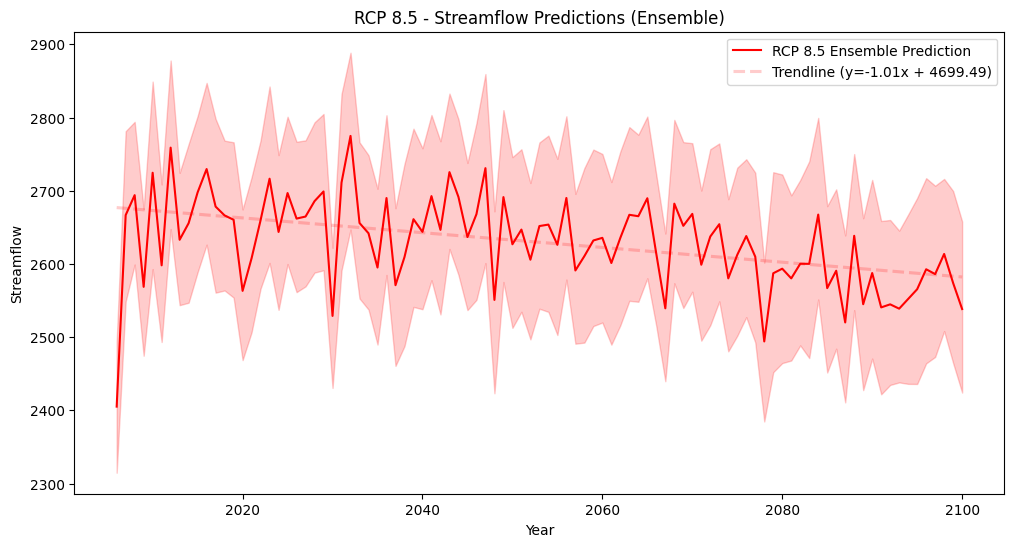
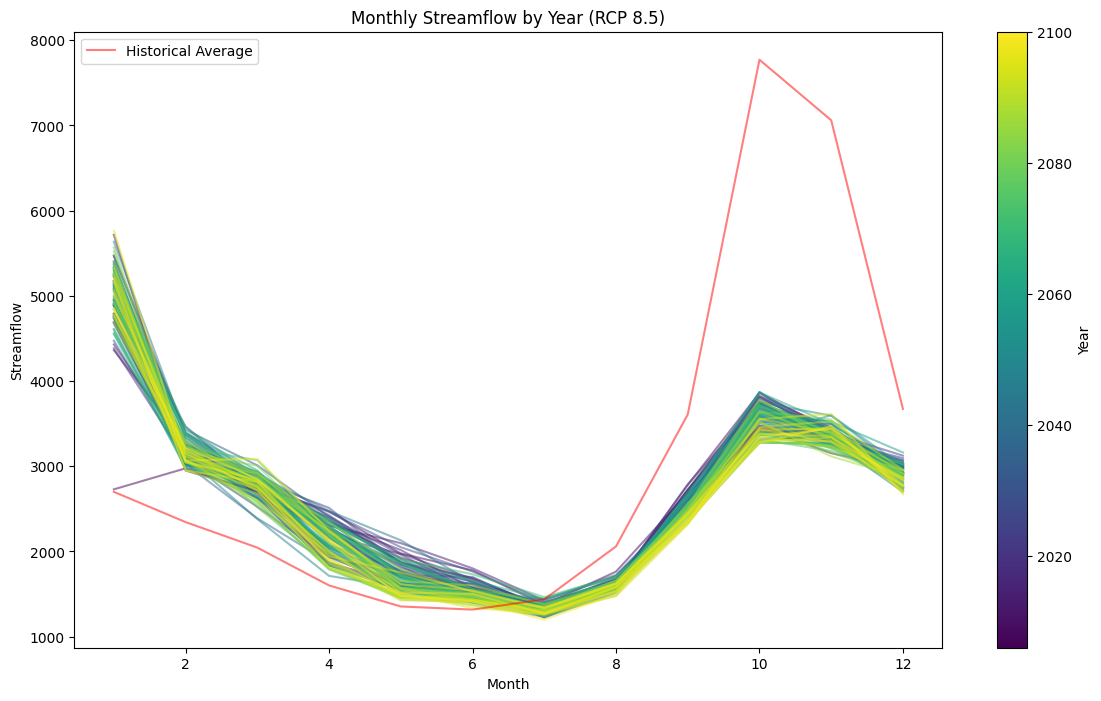
In conclusion, the RCP 4.5 and 8.5 both suggest a decrease to mean streamflow through the 21st century and highlight the importance of early action and planning to mitigate issues associated with water scarcity.